Alex Carchidi
Professionals in the clinical trial space have heard of the Sunshine Act, a law that in 2010 mandated transparency of financial transactions between pharmaceutical companies and those who would potentially favor the companies’ preferences unfairly, such as doctors and hospitals.
The premise of the Act was simple: publicize the data about institutional payments made in clinical trials. The goal was to reduce the amount of bribing going on in the clinical trial process, provide transparency to the financial influence sponsors were having on physicians, and to make fiscal ties between research funding and researchers easy for the public to uncover.
In theory, once the public knew which physicians, hospitals, and pharmaceutical companies were collaborating, it would be easier to protect patients by identifying biases in the clinical trial process. Clinical trials with negative results could still be deceptively published or left unpublished, but at a minimum, the public would know where money had changed hands.
Sidenote: We believe we've taken then original intentions of the Sunshine Act a step further. using our analytics dashboard, Sunshine Analytics. With this tool, users can visualize and export data from trials recorded in the Sunshine Database, spliced and diced by criteria such as therapeutic area or region, for the purpose of estimating operational costs.
Preliminary research suggests that there have been reductions in the prescription of drugs known for having especially aggressive physician “gifting” plans. Other preliminary research claims that while the Sunshine Act has allowed for examination of the issue of physician bribery, and linked money to downstream costs to the public, it’s too early to tell whether the Sunshine Act itself is having an effect.
For the Sunshine Act to be deemed effective, industry-wide compliance needs to be observed for a sustained period of time (say, 5 years). Has this been the case? Or are we on track?
To answer this question, we need to delve into the Sunshine Act’s database, which contains the information mandated in the Act.
The first data set we have from the Sunshine Act is old, but not ancient—2012’s data is viewable online. Each subsequent year should result in increased compliance with the Act.
We conducted our own investigation into Sunshine Act compliance. To do this, we used our analytics dashboard, Sunshine Analytics, which provides visualization, filtering, and exporting capability of the Sunshine Act database to BrackenData users.
Click Here to Get a Personal Demonstration of Sunshine Analytics
According to the Sunshine Act, we should be able to see the total number of payments that are being tracked, and have a corresponding entry for each payment dictating:
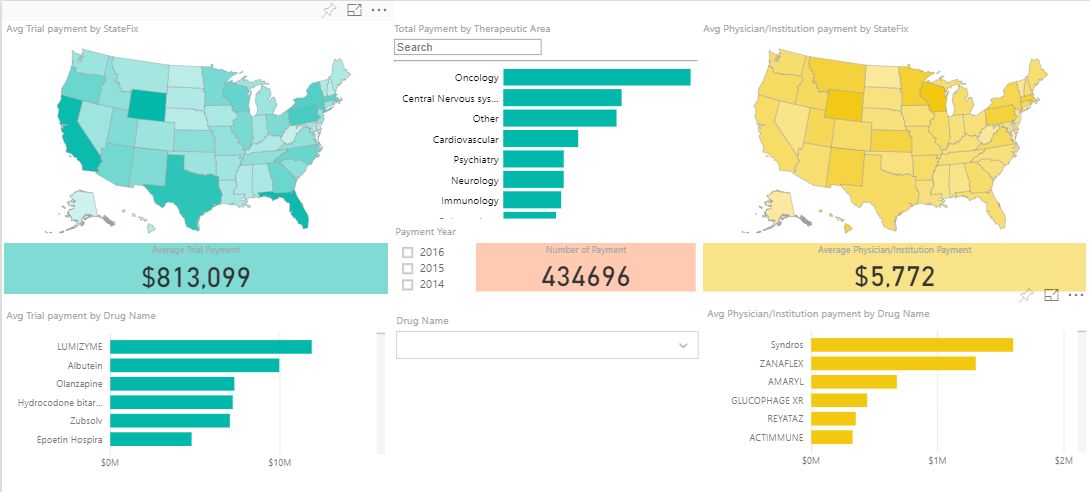
When we query the database, we can see that there are over 400,000 payments documented so far over the course of the Sunshine Act’s existence:

A screenshot of Sunshine Analytics, which shows stats of the Sunshine Act Database. Click to enlarge.
This number isn’t surprising, given that it captures data from multiple years of industry-funded trials in the U.S. But how much might the physicians at your local hospital be receiving in exchange for their participation in an industry-funded clinical trial?
$5772 is the average payment to a physician participating in registered trials.
Tweet This Stat | Share This Stat on Linkedin
What about the average total amount of money passing hands in a clinical trial? $813,099.
That’s no small chunk of change, but also reasonable understanding the scope of clinical trial budgets.
Now let’s go back to our original question: has there been industry-wide compliance with the Sunshine Act?
First, let’s set some parameters for our search.
We only want to look at trials that have had a fair chance of registering their data with The Sunshine Act. Because, according to NIH guidelines, a trial is permitted to take up to 12-months after completion to submit all data, we are going to look only at completed trials through 2015 (some 2016 trials are still not in the database).
This means we set a filter for “trial status = completed”, and looking at the years 2013 through 2015. 2,712 studies met our criteria. (found via Sunshine Analytics).
So, in our given window and with our stated criteria, there were 2712 clinical trials registered with the Sunshine Act. How does this compare to what the government’s ledger of clinical trials says?
Let’s compare the number of trials in ClinicalTrials.gov to what we’ve found in Sunshine Analytics.
Here are the criteria for our ClinicalTrials.gov query:
According to trial registrations in this period on ClinicalTrials.gov using the same criteria as before, there were 4720 studies ongoing in the US during our defined period of time.

The filters and results of our ClinicalTrials.gov query.
Looks like we’ve got a discrepancy, here.
The Sunshine Act has data from 2712 trials from 2013 through 2015. ClinicalTrials.gov has records on 4,720 studies on record that are industry-funded, in the US, and seen through to completion for the same date range.
2712/4720 = 57.46%
This implies a 57% industry compliance rate with the Sunshine Act.
Tweet This Stat | Share This on Linkedin
For each registered trial, there should be a registered Sunshine Act entry—yet for many trials, there is not. This means that at a minimum, 43% of industry conducted trials are presently noncompliant with the Sunshine Act. Given that these trials have been noncompliant for years now, it seems unlikely that they will be reporting their financials anytime soon.
Could it be that these industry-funded trials aren’t reporting their Sunshine Act payments as required, potentially to sway results? Or to escape the now-required trial transparency the US regulatory forces demand? Could there be a reason that nearly half of the industry’s studies are complying with The Sunshine Act and not receiving penalties?
We used this data analysis to answer our question “has there been industry-wide compliance with The Sunshine Act?”
We have our answer – a resounding no. But the data we have found leads to more questions…